Disclaimer
► The vast majority of numbers and amounts in this report are official data; the sources of such
data include the financial statements and annual reports of companies, information from the
official websites of the companies, and publications in media
► The financial statements of the companies have been obtained on the official websites of such
companies as well as from other sources
► If the source is not identified, such figures are calculations made based on judgment and
assumptions of the analyst. For such figures, the relevant calculation mechanisms and
assumptions are presented
► The red numbers in the report, for example (3), are solely a reference to sources of information.
The full list of sources is presented at the end of the report under the corresponding numbers
You should start reading the slide from
the key idea of the slide, which is
further explored in the slide
Key idea of the slide
A blue circle near the
► The vast majority of numbers and amounts in this report are official
1
data; the sources of such data include the financial statements and
text means that this
annual reports of companies, information from the official websites
report contains a
of the companies, and publications in media
separate slide with
► The financial statements of the companies have been obtained on the
additional information
official websites of the companies as well as from other sources
The sources are identified in the text,
on the relevant topic
► If the source is not identified, such figures are calculations made
but they are always marked with a
based on judgment and assumptions of the analyst. For such figures,
red number. The list of sources is
the relevant calculation mechanisms and assumptions are presented
presented at the end of the report
►2 The red numbers in the report, for example (3), are solely a reference
to sources of information. The full list of sources is presented at the
end of the report under the corresponding numbers
2
Mazepin Empire
Key observations (1/2)
►
Having nothing, Mr. Mazepin received billions of US dollars of Russian taxpayers in order to control Russian national
wealth. From 2004 through 2012, companies controlled by him acquired controlling interest in 4 major nitrogen
fertilizer producers with an approximate cost of acquisition of USD 1.1 billion (0). At the present moment, the assets
are under management of JSC «URALCHEM» (hereinafter, Uralchem). Most of the transactions have been financed by
Sberbank
►
In 2013, Mr. Mazepin acquired ~20% stake in potash giant PJSC Uralkali (hereinafter, Uralkali), the transaction was
financed by VTB Group, which issued a loan in the amount of USD 4.5 billion to Uralchem. After 5 years, the effective
ownership of Mr. Mazepin in Uralkali became ~89%. To achieve this goal, additional RUB 247 billion were spent, raising
from Sberbank and other foreign banks. The entire debt burden for the increase of the shareholding Mr. Mazepin
"hung" on Uralkali itself
►
These financial manipulations led to the total debt of Uralchem and Uralkali to banks in the amount of RUB 691 billion
at the end of 2018 or USD 11 billion in exchange for ~89% of the effective ownership in Uralkali, which holds 20%
market share of the global potash market and is a monopolist in the Russian market. The company's turnover in 2018
was equal to RUB 157 billion
►
Of RUB 691 billion of debt to banks at the end of 2018, RUB 590 billion were attracted for the purpose of seizing
control over Uralkali, however, these funds could have been spent on national projects in Russia, such as the
development of small and medium-sized business, and investments in enterprises. However, Mr. Mazepin did not
invest in the companies, spending money only to maintain business in operating condition, as it is apparent from the
lack of significant growth in production volume of Uralchem and Uralkali during the period of 2013-2018
►
Mr. Mazepin is not going to repay the borrowed funds to the banks, as according to the RAS financial statements of
the companies, debt repayment is mainly carried out by raising new loans from different banks. The total average
annual operating cash flow of Uralchem and Uralkali after deduction of interest and capital expenditures for
maintenance of fixed assets in 2016-2018 was approximately RUB 32.6 billion (RUB 34.3 billion relate to Uralkali and
minus RUB 1.7 billion relate to Uralchem), with the debt at the end of 2018 being RUB 691 billion. This is equivalent to
more than 20 years of debt repayment
►
In fact, this period can be significantly longer than 20 years, as in 2021-2022 EuroChem will launch its main potash
project with a planning capacity of 7.3 million tons per year at the first stage with increase to 14.6 million tons per year
by 2024. In comparison, production volume of Uralkali in 2018 was equal to 11.5 million tons. It is obvious that two
companies with such volumes will not fit and that the market will not be ready for such a significant increase in
consumption. Uralkali may expect a significant deterioration in its financial condition due to competition
3
Mazepin Empire
Key observations (2/2)
►
From a financial point of view, Uralchem matters have been much more serious for a long time. Over the last 5 years,
from 2014 to 2018, the company's net assets were negative and during the same period the company had a net loss in
4 out of 5 years. Moreover, the average annual operating cash flow for the period 2016-2018 after repayment of
interests and capital expenditures for maintenance of fixed assets was a negative value of minus RUB 1.7 billion. At
the same time, the debt to the banks was equal to RUB 282 billion. Thus, repayment of loans and borrowings is
impossible. Mr. Mazepin hopes only for Uralkali, but EuroChem will dash these hopes in the near future
►
The integrity of Mr. Mazepin in paying taxes raises reasonable doubts. A closer analysis may show a skillful
underpayment of a significant amount of taxes to the Russian budget by Uralchem and Uralkali for the period of 2014-
2018, which may have a range from RUB 83.7 to RUB 105.9 billion. The need to pay a substantial amount of interests
and foreign currency revaluation of loans and borrowings (Mr. Mazepin borrows loans for his companies mainly in
foreign currency) understates the income tax base annually. At the same time, the Government may collect the unpaid
amounts of taxes past the three-year statute of limitations only by opening criminal cases
►
Uralchem’s shareholders have not received dividends since 2015, and Uralkali has paid to shareholders only RUB 27
million since 2015 while the net profit was RUB 132 billion. The dividend tax rate in Russia is 15%, but it is 0% for non-
residents in Latvia. Income tax rate in Latvia is 5% less than in Russia…
►
In Latvia, Mr. Mazepin registered controlled [by him] traders, through which he sells products to export markets, while
Uralchem’s and Uralkali’s main focus is export. If the traders are controlled, nothing prevents Mr. Mazepin from
controlling sale prices from Russia to his own traders abroad. Mr. Mazepin controls traders not only in Latvia, but also
in other countries where he sells products extracted from the wealth of the Russian subsoil. The relationships and
prices among the controlled traders abroad are unknown, as the state authorities are not able to verify such
transactions from Russia
►
However, the relationships between Mr. Mazepin and Latvia are open to the entire world since he registered not only
traders, which generate significant profit and, as we believe, fail to pay taxes in Russia, but he also built the terminal
for transshipment of bulk fertilizers in the port of Riga in Latvia in 2013 and a year later, purchased the terminal for
transshipment of liquid ammonia at Ventspils port. Why not in Russia?
►
In Latvia, Mr. Mazepin also acquired Sconto soccer club and a hotel in Jurmala, while nothing has been invested in a
significant expansion of production of both companies in Russia since 2013, only for maintaining them in the
operating condition. And why? Uralchem and Uralkali have already been re-registered to Cyprus offshore companies
and no longer belong to Russia. Moreover, in accordance with some media reports, Mr. Mazepin already has a
residence permit in Latvia
4
Mazepin Empire
Having nothing, Mr. Mazepin received billions of US dollars of
Russian taxpayers in order to control Russian national wealth
Currently, Mr. Mazepin controls 2 multibillion-dollar turnover companies - Uralchem and Uralkali. The total turnover of these
1
companies in 2018 amounted to RUB 238 billion in accordance with RAS financial statements (1) or 0.29% of GDP of Russia (2)
►
Both companies produce mineral fertilizers from the national wealth of Russia. Uralchem uses natural gas for the production of
its main products - ammonia, urea and nitrate, and Uralkali - potash ore from 5 mines of the Ural region in Russia and holds
20% share of the world market (15) according to the company’s own data
►
Uralchem was founded in 2007, later consolidating 4 production assets:
2
► In 2004, Kirovo-Chepetsk chemical plant (currently, a branch “KCCP”) was purchased for USD 108.35 million at auction
(3). The story is silent on which money and how Mr. Mazepin, the former head of SIBUR, acquired control over the
above-mentioned production asset. One thing is known for sure that Mazepin never owned large assets and always was
an employed top-manager. At the same time, exactly during this auction Mr. Mazepin managed to overbid the offer of
Gazprom (!)
► In 2007, he obtained control over Berezniki “Azot” (currently, a branch “Azot”). The transaction value was not disclosed
but, according to analysts, the value of the asset could be from USD 264 to 377 million (4)
► In 2008, Uralchem received a loan in the amount of USD 700 million from Sberbank (5). Part of the loan was spent to
acquire control over JSC Voskresensk Mineral Fertilizers
► In 2012, Mr. Mazepin purchased Perm “Mineral Fertilizers" (currently, a branch "PMU") for approx. USD 300 million from
SIBUR (7)
In 2008, Mr. Mazepin turned his attention to another major producer of mineral fertilizers, Togliattiazot, firstly bought 7.5% of
shares from Viktor Vekselberg in 2008 (6). Subsequently, the shareholding was increased to 10% (6). Now, Mr. Mazepin is
actively fighting for this asset, accusing the former owners and top management of the company of the theft of previously
sold products. The conflict and the proceedings continue till the present time
(Х) - Reference to the source of information. The full list of sources of
5
information is presented at the end of the report
Mazepin Empire
Mr. Mazepin's purpose is to take over the Russian fertilizer
industry, simultaneously burdening the industry with significant
uncollectable loans
In 2013, VTB Group extended a USD 4.5 billion loan to Uralchem (8), a part of which in the amount of RUB 126 billion (8), was
3
directed to the acquisition of ~20% shares in Uralkali (9), secured by the same shares. However, before this transaction, Uralchem
had already had a debt of RUB 9 billion to Sberbank (10). As a result, this debt was restructured by Sberbank extending the
maturity date from October 2013 to October 2015
►
Immediately after the Uralchem acquisition of ~20% share in Uralkali, Uralkali received a credit approval from Sberbank for a new
credit line of up to USD 2 billion in December 2013 (11) for buying out shares of minority shareholders
The buy-out of shares from minority shareholders began by Uralkali in 2014, after Mr. Mazepin joined the company. For 5 years
3
from 2014 to 2018, the buy-out amount was RUB 247 billion (12), for which many loans were raised from both Russian and foreign
banks. Uralkali undertook the entire debt burden (interest, fees and foreign currency revaluation) of these loans
►
The total percentage of repurchased shares was ~55% as at 31 December 2018. These shares were transferred to Uralkali-
3
Technology, a wholly-owned subsidiary. The transferred shares became quasi-treasury, thus, proportionally increasing the
voting share of the other shareholders of Uralkali (47;77;78)
►
Also in 2016, Mr. Lobyak, a classmate of Mr. Mazepin from the Suvorov military school in Minsk, acquired control over ~20% of
3
Uralkali (13) by purchasing this stake through an offshore company, Rinsoco Trading, from ONEXIM group, which belonged to
Mr. Prokhorov. At the same time, Mr. Lobyak worked for Mr. Mazepin and led one of his structures in Belarus - «Yuras Oil». From
this perspective, there is no secret for anybody who actually is the real beneficiary of the ~20% stake owned by Mr. Lobyak and
under which financial guarantees these shares were purchased
►
As at 30 June 2019, Mr. Mazepin and Mr. Lobyak formally hold more than ~40% in Uralkali in the aggregate, but taking into
3
account the fact that the remaining ~55% are owned by Uralkali-Technology, a wholly-owned subsidiary, their effective ownership
(control) is ~89% (14) - in fact the full control
(Х) - Reference to the source of information. The full list of sources of
6
information is presented at the end of the report
Mazepin Empire
Mazepin has built a financial pyramid: from 2013 to 2018, Uralchem
and Uralkali received RUB 537 billion of loans, which were directed
solely for the seizure of control over Uralkali, but not on investments
in the Russian economy
According to RAS financial statements, at the end of 2018, the aggregate indebtedness of Uralchem and Uralkali for borrowed
4►
funds amounted to RUB 691 billion (16) or USD 11 billion at the rate of 63 rubles per 1 US dollar. Of which, RUB 409 billion (USD
6.5 billion) was the indebtedness of Uralkali and RUB 282 billion (USD 4.5 billion) was the indebtedness of Uralchem (16)
If we consider dynamics, the total debt of Uralchem and Uralkali was increased by more than 4.5 times or RUB 537 billion (from
4
RUB 154 billion to RUB 691 billion) since the beginning of 2013 through the end of 2018 (16). Both companies refinance their
5
debt to banks on a regular basis
►
The purpose of the total debt increase since the beginning of 2013 through the end of 2018 (RUB 537 billion) was not the
6
development of companies or investments into the Russian economy. It was only the seizure of control by Mr. Mazepin over
Uralkali, the largest company in the industry, in his own interest:
► Uralchem's investments in fixed assets for 6 years from 2013 to 2018 amounted to ~ RUB 16 billion (17), which is a
negligible amount compared to the growth of the debt balance by RUB 252 billion for the same period (18). At the same
7
time, there was no significant growth in production: in 2013, the volume of production amounted to 6 million tons (19), in
2018 - 6.4 million tons (20). Thus, investments were used solely to support current activities
► Uralkali’s investments in fixed assets for 6 years from 2013 to 2018 are considerably larger ~ RUB 83 billion (21), which at
7
first glance looks like a good result, but these investments are explained by the peculiarities of the business for the
extraction of potassium chloride including liquidation of the systematic accidents in the mines, e.g. sinkhole. The
increase of the debt balance for the comparable period amounted to RUB 285 billion (22)
► The volume of production was not increased, and on the contrary, only decreased by 5% or 0.6 million tons: 2014 - 12.1
7
million tons (23), 2018 - 11.5 million tons (23). Thus, all funds invested by Uralkali were also aimed only for maintaining
the company in operating condition
►
More than USD 6.5 billion (49) of the above-mentioned borrowings relate to loans received from state banks such as Sberbank
and VTB Group. Banks could issue these funds for national projects of the Russian Federation, for the development of small
and medium-sized business, so for the development of the Russian economy. But the banks were essentially deceived
►
Moreover, in case of non-repayment of loans, they will be written off to losses of the state banks net of the market value of
collateral. It will reduce the taxable profit of banks and thus, reduce the amount of income tax and tax on dividends payable to
the budget
(Х) - Reference to the source of information. The full list of sources of
7
information is presented at the end of the report
Mazepin Empire
Mr. Mazepin will not be able to repay loans to both state and
foreign banks, which will damage the economy and the image of
the Russian Federation, respectively
The average annual cash flow from Uralkali's operating activities for the period from 2016-2018 after deduction of interest and
8►
mandatory capital expenditures for maintaining the business in operating condition was RUB 34 billion (24). Therefore, Uralkali
10
may have a maximum amount of RUB 34 billion per year for the repayment of the total debt, which at the end of 2018 amounted
to RUB 409 billion (16). It is about 12 years of repayment
►
Uralkali is starting to compete with EuroChem Group in the Russian and global potash market, as the latter launches the
“EuroChem-Usolskiy” project - development of the Verkhnekamskoe potash deposit with reserves of about 2.3 billion tons of
ore (26). In 2018, 1.38 million tons of potash ore were produced (25), with the planned design production capacity of 2.3 million
tons per year (25)
►
In 2021 - 2022, EuroChem will launch the second project “EuroChem-VolgaKaliy” - development of Gremyachinskoe deposit in
Volgograd region with total reserves of about 1.6 billion tons of ore (27)
►
In 2018, Uralkali produced 11.5 million tons of potash ore (23), while EuroChem Group plans to reach the capacity of 7.3 million
tons in 2021 (27) and to increase capacity to 14.6 million tons annually by 2024 (26), which will certainly create significant
difficulties for Uralkali (even without taking into account the project “EuroChem-Usolskiy”)
►
If Uralkali has 20% of the world market (15), it is unlikely that the world market will withstand a much larger player in the face of
10
EuroChem Group. Any person, even without a special higher education, engaged in trading, understands the simple things - the
glut of the market with products will pull down prices and reduce volumes for 1 market player, which will have an extremely
negative impact on the financial condition of Uralkali and the ability to repay such a significant debt
►
With EuroChem entering the market, the repayment period of borrowed funds by Uralkali will definitely be much longer and will
be increased at least by 2 times, and the risk of non-repayment of loans and borrowings will increase significantly
►
At the same time, according to IFRS financial statements for 2018, Uralkali is going to significantly expand the credit limit with
Sberbank (28). Does Sberbank take into account the abovementioned circumstances? Sberbank can be deceived, which can
damage the economy of Russia in the form of non-repayment of loan funds
►
Moreover, capitalization of Uralkali since the end of 2013 has decreased by more than 2.5 times from RUB 506 billion to RUB
11
246 billion (29). The company's shares are pledged to banks and do not cover its total debt. In the case of a further decline of
market prices for potassium chloride due to the entry of EuroChem, which is more than likely, the decrease of capitalization will
continue
(Х) - Reference to the source of information. The full list of sources of
8
information is presented at the end of the report
Mazepin Empire
Now Uralchem is on the verge of bankruptcy, net assets were
negative from 2014 to 2018. Therefore, the company is subject to
liquidation in accordance with p.4 of art. 99 of the Russian Сivil
Сode
►
The situation is much worse for Uralchem as the company's net assets have been negative since 2014. At the end of 2014, they
12
amounted to minus RUB 77 billion (30) and at the end of 2018, they were record low of minus RUB 113 billion (31). Net assets
are assets of the company that are not burdened with liabilities. In other words, it is property earned by the company for the
benefit of shareholders, but Uralchem has negative assets
►
It is worth adding the following to the fact of negative net assets of Uralchem:
► there was net loss in the periods 2014-2015 and 2017-2018. The total financial result for the period of 5 years for 2014-
2018 was net loss in the amount of RUB 96 billion (33)
9
► the average annual cash flow from operating activities of Uralchem for the period of 2016-2018 after the payment of
interest and mandatory capital expenditures to maintain the business in operating condition was negative and was equal
10
to minus RUB 1.7 billion (32)
4
► accumulated debt on borrowed funds at the end of 2018 amounted to RUB 282 billion (16)
10
► thus, debt repayment by using own funds is impossible
On the basis of extremely negative performance indicators, there is no doubt that Uralchem constantly breaches covenants,
i.e. banks (primarily Sberbank) may at any time claim early repayment of loans
►
Since 2015 Uralchem Group has stopped publishing IFRS financial statements. The most likely reason is the refusal of the
opinion by the big4 auditor, Deloitte, due to the group’s inability to continue its operations as a going concern in the
foreseeable future, i.e. its probable liquidation
1►
According to p.4 of art.99 of the Civil Code of the Russian Federation, if joint-stock company has negative net assets within 2
and more years, it is subject to liquidation. Uralchem's net assets have been negative for 5 years since 2014. The Federal Tax
Service of Russia has the right to sue the company of any organizational-legal form on the grounds established by the laws of
the Russian Federation and the Central Bank of the Russian Federation has the right to issue orders to remedy violations of
legal requirements (Federal law "On joint stock companies"), but no action is taken! Why? Is Mr. Mazepin covered by certain
officials, or does he cleverly manage to deceive the state authorities?
►
Uralchem is subject to liquidation on the basis of p.4 of art.99 of the Civil Code of the Russian Federation
►
In case of liquidation of Uralchem, almost all of its market share, including the export market, will be divided between Russian
companies-competitors, which instead of Uralchem conduct efficient economic activities and are conscientious taxpayers. For
example, these companies are Kuibyshevazot, Togliattiazot, NAK Azot, Nevinnomyssk Azot. Thus, the Russian budget will
finally begin to receive revenue for income tax and dividends. Looking ahead, it is from RUB 9.2 billion to RUB 10.4 billion per
year (34)
1►
The main creditor of Uralchem is VTB Group, loan from which is essentially unsecured. Even if VTB forecloses on the ~20%
1
shares in Uralkali from Uralchem, VTB will have a loss due to the low value of the collateral that is unequal to the loan value,
because the market price of shares has declined since their purchase more than 2 times (29)
(Х) - Reference to the source of information. The full list of sources of
9
Mazepin Empire
information is presented at the end of the report
The integrity of Uralchem and Uralkali in calculating and paying taxes
is raising reasonable doubts. There is a reason to believe that the
underpayment of taxes by these companies for the period of 2014-
2018 was within the range of RUB 83.7 to RUB 105.9 billion
►
Uralchem and Uralkali raised credit funds in foreign currency for the repurchase/buy-out of shares in Uralkali. Foreign currency
liabilities have been subject to revaluation due to depreciation of ruble against dollar, which depreciated by more than 2 times for
the period of 2014-2018
►
Interest and foreign currency revaluation on foreign currency loans were recognized by Uralkali and Uralchem as expenses that
reduced taxable profit for the period of 2014-2018. Accordingly, income tax payments to the Russian budget were significantly
reduced
1►
The total amount of expenses incurred for the period of 2014-2018 was:
► Interest expense: RUB 64.1 billion by Uralchem (80), RUB 48.6 billion by Uralkali (80)
21
► Foreign currency revaluation: RUB 126.6 billion by Uralchem (35), RUB 64 billion by Uralkali (35)
►
Interest and currency exchange differences on loans can reduce taxable profit only if the loan is spent by the company on activities
aimed for earning income (art. 252 of the Tax Code of the Russian Federation)
►
Uralchem acquired ~20% stake in Uralkali for RUB 126 billion (8;9) in December 2013 by using a foreign currency loan from VTB
Group. The market value of Uralkali's share of ~20% was equal to RUB 100 billion in December 2013 (79). A significant excess of the
acquisition cost over the market value in the amount of RUB 26 billion should have been seriously analyzed
►
Prior to the acquisition by Mr. Mazepin, Uralkali consistently paid dividends in average in the amount of RUB 19.5 billion per year
(RUB 58 billion for the period of 2011-2013) (66). However, starting from 2015, the total amount of dividend payments has been only
RUB 27 million (66), i.e. Uralchem received almost no income from the investment in Uralkali. The reason for this was the
subsequent large-scale buy-out of shares of Uralkali by using credit funds in foreign currency (including USD 2 billion from
Sberbank (11)), for which the company recognized interests and currency exchange differences. Uralkali incurred expenses in the
total amount of RUB 102.6 billion for the period of 2014-2018 and also had no free funds for payment of dividends, directing the
existing funds to the current debt service and repayment of the received loans (already at the increased exchange rate of RUB/USD)
►
Thus, the received credit funds were not spent by both companies to generate income. We believe that they were spent for the
personal benefit of one person, Mr. Mazepin.
15►
After the takeover of Uralkali by Mr. Mazepin in December 2013, the total amount of underpaid taxes to the Russian budget for the
16
17
period of 2014-2018 can range from RUB 37.9 billion to RUB 54.1 billion by Uralkali (41) and from RUB 45.8 billion to RUB 51.8
billion by Uralchem (42)
19
20
►
The tax authorities should pay attention to the tax burden of Uralkali and Uralchem and assess the integrity of tax optimization on
21
these transactions
►
Undisguised friendship of Mr. Mazepin with certain high-ranked officials from law enforcement agencies (in particular from the
Investigation Committee of the Russian Federation) and the Federal Tax Service of the Russian Federation helped to hide the true
state of affairs with taxation. Could these relationships of Mr. Mazepin help him to escape liability now? It is also worth noting, that
the Government may collect the unpaid amounts of taxes past the three-year statute of limitations only by opening criminal cases
(Х) - Reference to the source of information. The full list of sources of
10
Mazepin Empire
information is presented at the end of the report
Financially comparable companies pay significantly more taxes to
the budget than Uralchem and Uralkali, which confirms the bad
faith of tax calculations and underpayment of taxes
13 Uralkali has virtually terminated dividend payments and substantially reduced payments of income tax starting with 2014. After
Mazepin’s arrival over a period of 5 years in 2014-2018, the company paid only RUB 13.5 billion of income tax (36). For example,
for the period of 3 years in 2011-2013, it paid RUB 24.5 billion of income tax (37)
14
► For example, LUKOIL-Perm, also being the largest enterprise in the Perm region, paid 4 times more of income tax to the budget
for the period of 5 years in 2014-2018 than Uralkali - RUB 53.5 billion (38)
18
► Uralchem, in comparison with similar companies, has the highest rates of revenue and profit on sales, but also does not pay
taxes. Since the end of 2013, only RUB 2.7 billion (39) of income tax and dividend tax have been paid.
18
►
2 peer companies belonging to the Swiss EuroChem Group, Nevinnomyssk Azot and NAK Azot, having a lower profit margin on
sales jointly paid since the end of 2013 RUB 39.9 billion (40) - 15 times more than Uralchem
► It is worth considering what will happen with other companies in the industry of mineral and nitrogen fertilizers, to which Mr.
Mazepin will turn his interest, after the complete buy-out of shares from minority shareholders of Uralkali. Further actions will be
taken in a similar way: a bank loan for the purchase of shares - purchase of shares (obtaining control) - squeeze-out of minority
shareholders - obtaining new loans - reduction of tax payments to the Russian budget
► How long will Mr. Mazepin continue to do the same? How much the budget of Russia will not receive? Which company will be the
next victim? We believe that at this rate, according to the established scheme, Mr. Mazepin has the opportunity to seize control
over the entire industry of mineral and nitrogen fertilizers in Russia. We also believe that he will continue to buy property for his
own purposes at the expense of underpaid taxes
(Х) - Reference to the source of information. The full list of sources of
11
information is presented at the end of the report
Mazepin Empire
Uralchem has not paid dividends since 2015, Uralkali has paid only RUB
27 million to shareholders since 2015, while the net profit was RUB 132
billion. At the same time, all export transactions are carried out through a
chain of controlled traders
►
Uralkali sold 11.1 million tons of potash ore in 2018 (11.5 million tons were produced) (23). Against the background of such large
sales, the export share, according to the company, was equal to 76% in 2018 (43). Export sales are made through traders
controlled by Mr. Mazepin - Uralkali Trading SIA, Uralkali Trading SIA - Panama Branch, Uralkali Trading SIA - India Branch,
Uralkali Trading SIA - Singapore Branch, Latvia Uralkali Trading SIA Beijing Representative Office, Uralkali Trading SIA - Turkey
Branch (44)
►
Uralchem also has the export orientation but the exact sales amounts are hidden from the public. The company does not hide
that it sells all export products through controlled traders, in particular, SIA Uralchem Trading (44)
►
Main traders, Uralkali Trading SIA and SIA Uralchem Trading, are registered in Latvia, an unfriendly to Russia country. The
companies’ operating profits are tens of millions of US dollars. Thus, a significant part of taxes does not remain in the Russian
economy
►
We believe that the goal of deception in Mr. Mazepin’s sales model is that all export traders are under his control, that means he
controls the pricing of sales of products from Russia to foreign traders, which leaves them with a significant profit. Transactions
are made abroad, thus, no one can be sure that there are the real buyers behind the Latvian traders - it can be a chain of their
own traders, where the difference between the purchase price and sale price of products can be more than tens of millions of US
dollars, e.g. hundreds of millions. Some other companies are URALCHEM TRADING DO BRAZIL LTDA, Uralkali Trading
Fertilizantes Brasil LTDA, Uralkali Trading Chicago (44)
►
We cannot exclude the possibility that all controlled foreign traders resell products to each other intentionally to leave a
significant profit abroad. Information on these transactions cannot be verified from Russia. The funds to buy ~20% stake in
Uralkali could have been transferred to Rinsoco Trading of Mr. Lobyak in this exact way (for example, in the form of borrowing).
►
The evidence of the accumulation of significant funds abroad bypassing the Russian economy may be a loan of USD 650 million
given by the company Uralkali Finance DAC to Uralkali in 2013 (45). How the same-name company (Uralkali Finance DAC) could
generate such significant funds abroad, which were available for credit facility?
►
Why should Mr. Mazepin pay dividends in Russia or pay taxes at a relatively high rate to the Russian budget, when it is possible
to receive dividends from foreign controlled traders abroad? For example, in Latvia, there is no tax on dividends for non-
residents at all, and the income tax rate is also lower than in Russia, only 15%. Moreover, no one will be able to see and verify in
Russia the tax payments, implemented by Mr. Mazepin abroad
(Х) - Reference to the source of information. The full list of sources of
12
information is presented at the end of the report
Mazepin Empire
Uralchem and Uralkali do not belong to Russia anymore - Mazepin
re-registered companies to offshore zones
►
100% share of Uralchem belongs to Uralchem Holding P.L.C., registered in Cyprus, which in its turn belongs to QUILAN
MANAGEMENT LTD, registered in the Virgin islands, and ~86% owned by Mr. Mazepin (46)
► Uralchem, in its turn, owns ~20% share of Uralkali (47). Another ~20% share of Uralkali belongs to the Cyprus company, Rinsoco
Trading (47), ~55% shares are quasi-treasury and owned by Uralkali-Technology (47), which is a wholly-owned subsidiary of
Uralkali (47). Effective ownership (control) of Uralchem and Rinsoco Trading over Uralkali as at 30 June 2019 was ~89% (14)
► Foreign registration of assets means for Russia the withdrawal of tax proceeds, dividends, as well as, perhaps, the assets
themselves outside of the Russian economy. In case of disagreement of Mr. Mazeptin with Russian authorities and banks it can
be very difficult or almost impossible to seize the property of foreign companies in foreign courts
Mr. Lobyak
Mr. Mazepin
(Mazepin’s partner)
~86%(46)
100%(48)
QUILAN MANAGEMENT LTD
Bromwich investments LTD
Virgin Islands
Virgin Islands
~100%(46)
100%(48)
Uralchem Holding P.L.C. - Cyprus
Minority shareholders
Rinsoco Trading - Cyprus
~5%(47)
~100%(47)
~20%(47)
~20%(47)
~55%(47)
Uralkali
Uralchem
Uralkali
Technology
100%(47)
(Х) - Reference to the source of information. The full list of sources of
13
information is presented at the end of the report
Mazepin Empire
Summary of explanatory information
1.
Dynamics of cumulative revenue of Uralchem and Uralkali for the period of 2012-2018
2.
Structure of production assets of Uralchem as at 2018
3.
Dynamics of the change of equity structure of Urkalkali from 2013 to 2019
4.
Dynamics of the balance of borrowed funds of Uralchem and Uralkali for the period of 2012-2018
5.
Dynamics of proceeds and repayments of loans and borrowings by Uralchem for the period of 2013-2018
6.
Dynamics of proceeds and repayments of loans and borrowings by Uralkali for the period of 2013-2018
7.
Dynamics of capital expenditures and production volumes for Uralkali and Uralchem for the period of 6 years in 2013-2018
8.
Average annual operating cash flows of Uralkali for the period of 2016-2018, after deduction of interest and mandatory capital
expenditures to maintain the business in operating condition
9.
Average annual operating cash flows of Uralchem for the period of 2016-2018
10.
Forecast repayment of loans and borrowings by Uralchem and Uralkali
11.
Dynamics of changes in net assets of Uralchem for the period of 2013-2018
12.
Dynamics of capitalization and total debt of Uralkali since the end of 2013
13.
Dynamics of key performance indicators for Uralkali for the period of 2011-2018
14.
The largest taxpayers of Perm region for the period of 5 years in 2014-2018
15.
Assumptions used in calculating the amount of underpaid taxes by Uralkali to the budget of the Russian Federation for the period of
2014-2018
16.
Assumptions used in calculating the amount of underpaid taxes by Uralkali to the budget of the Russian Federation for the period of
2014-2018 (continued)
17.
Calculation of the amount of underpaid taxes by Uralkali for the period of 5 years in 2014-2018
18.
Key performance indicators of major comparable companies similar to Uralchem over a period of 5 years, 2014-2018.
19.
Assumptions used in calculating the amount of underpaid taxes by Uralchem to the budget of the Russian Federation for the period
of 2014-2018
20.
Assumptions used in calculating the amount of underpaid taxes by Uralchem to the budget of the Russian Federation for the period
of 2014-2018 (continued)
21.
Calculation of the amount of underpaid taxes by Uralchem for the period of 5 years in 2014-2018
(Х) - Reference to the source of information. The full list of sources of
14
information is presented at the end of the report
Mazepin Empire
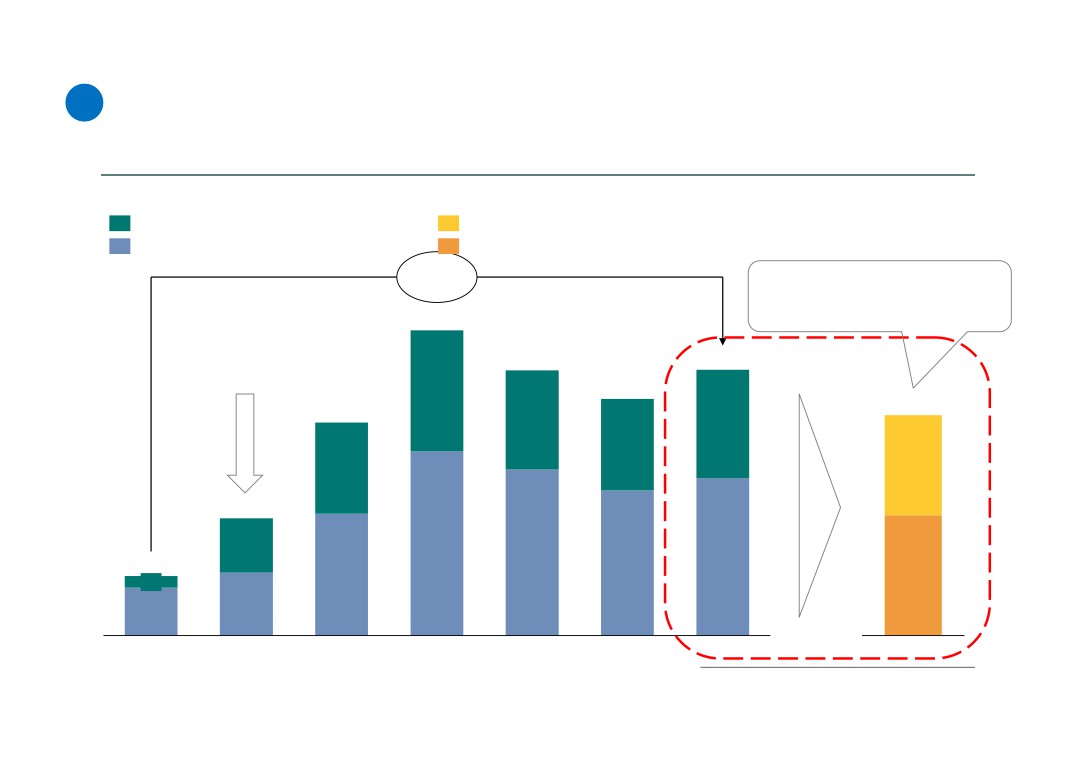
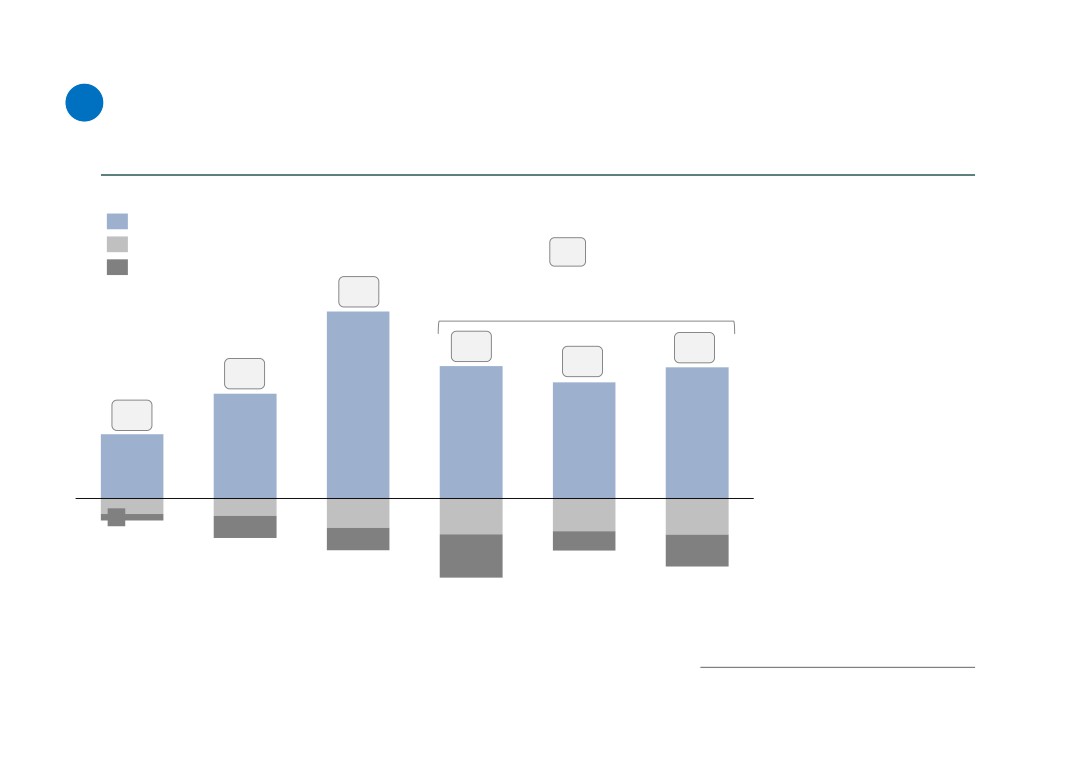
Currently, Mr. Mazepin controls 2 multi-billion turnover companies
Uralchem and Uralkali. The total turnover of these companies for 2018
1
amounted to RUB 238 billion in accordance with RAS Financial
statements or 0.27% of GDP of Russia
Dynamics of cumulative revenue of Uralchem and Uralkali
for the period of 2012-2018, RUB billion (1)
Uralchem
238
Uralkali
►
Increase of revenue
217
since 2013 is explained
by favorable market
198
environment and
191
81
45
condition for Uralchem
and UraIkali, as well as
devaluation of ruble
62
60
exchange rate, as both
146
companies are export-
133
oriented
27
119
23
►
There was no increase
23
in production volumes
and, as a result, sales
172
volumes
157
136
►
GDP of Russia is RUB
131
119
110
103.6 trillion in
96
accordance with
Kommersant (2)
2012
2013
2014
2015
2016
2017
2018
(Х) - Reference to the source of information. The full list of sources of
information is presented at the end of the report
Mazepin Empire
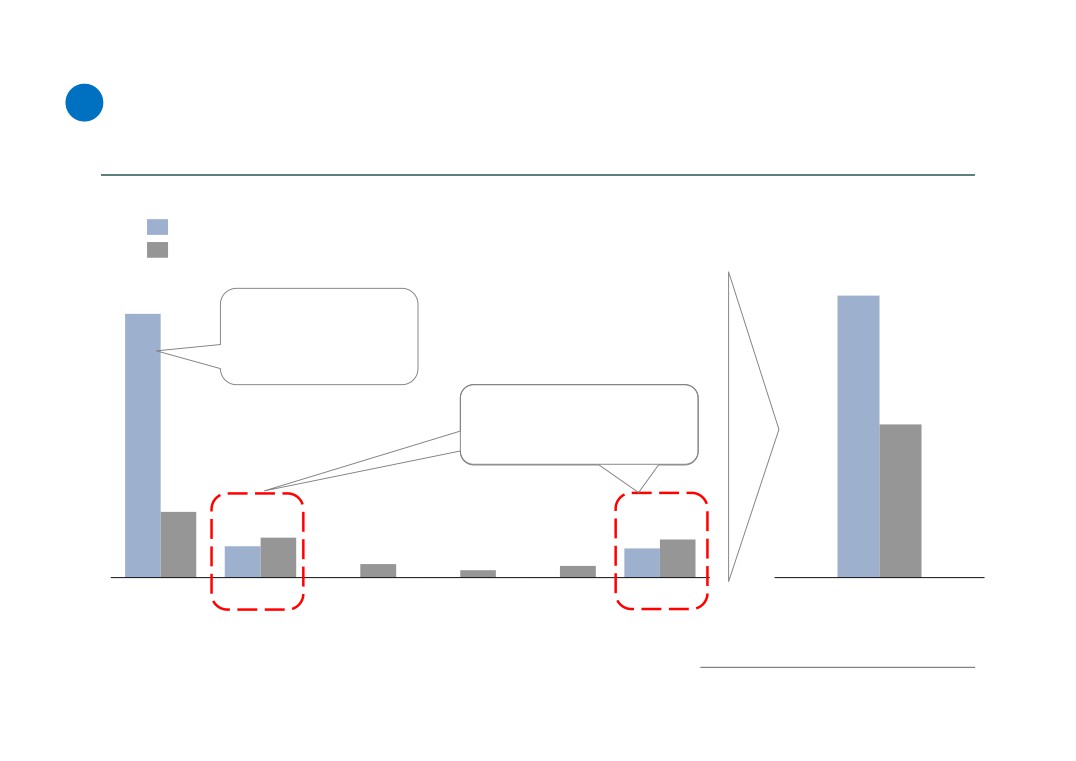
Uralchem controls 4 major production assets at the moment. Assets were
2
purchased by Mr. Mazepin mainly by using borrowed funds during the
period of 2004 - 2012
Structure of production assets of Uralchem as at 2018
Uralchem was
founded in 2007
URALCHEM
JSC Voskresensk
KCСP Branch
PMU Branch
Azot Branch
Mineral Fertilizers
How and for whose
PMU Branch, former
Azot Branch, former
In 2008, Uralchem
funds Mr. Mazepin
“Minudobreniya”, was
Berezniki “Azot”, was
received a loan from
acquired this asset?
purchased for USD 300 mln.
purchased in 2007. The
Sberbank in the amount
According to the press,
from SIBUR in 2012 (7)
value of the company is
of USD 700 mln., 382
KCСP Branch was
estimated by analysts
USD mln. of which were
purchased at auction for
approximately from USD
spent for the purchase
USD 108.35 mln. Where
264 mln. to 377 mln. (4)
of JSC VMF (5)
Mr. Mazepin could find
such significant personal
funds in 2004? Moreover,
during the tender Mr.
Mazepin managed to
overbid the offer of
Gazprom (3)
(Х) - Reference to the source of information. The full list of sources of
information is presented at the end of the report
Mazepin Empire
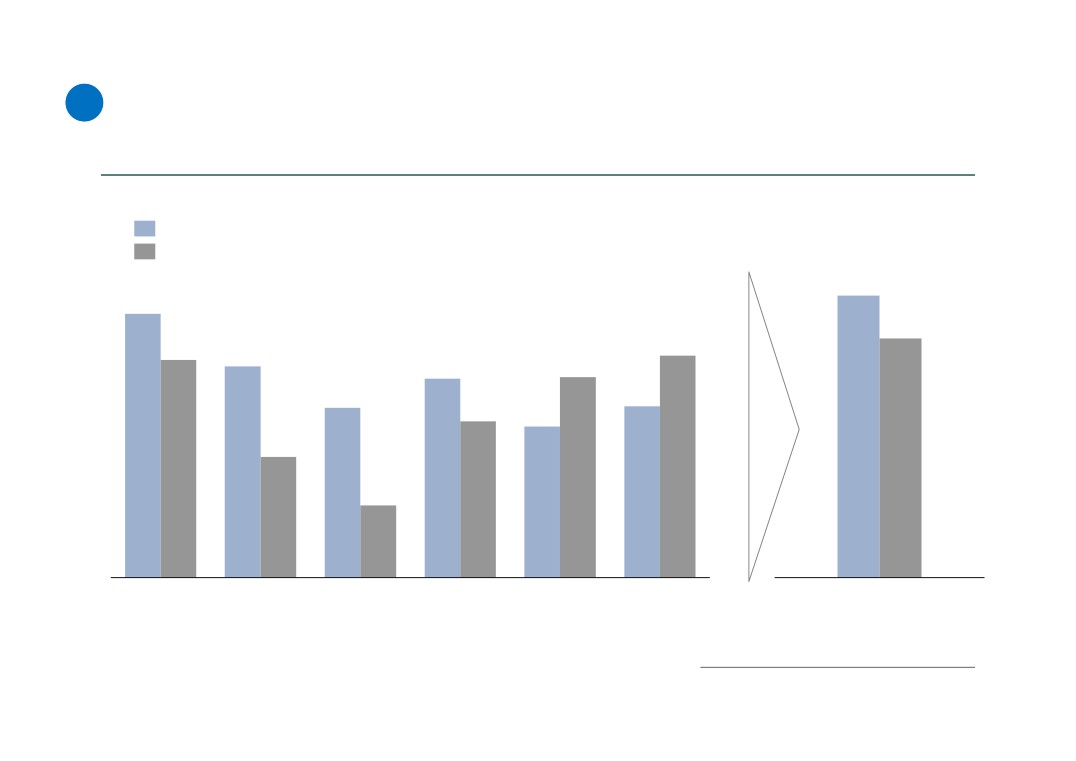
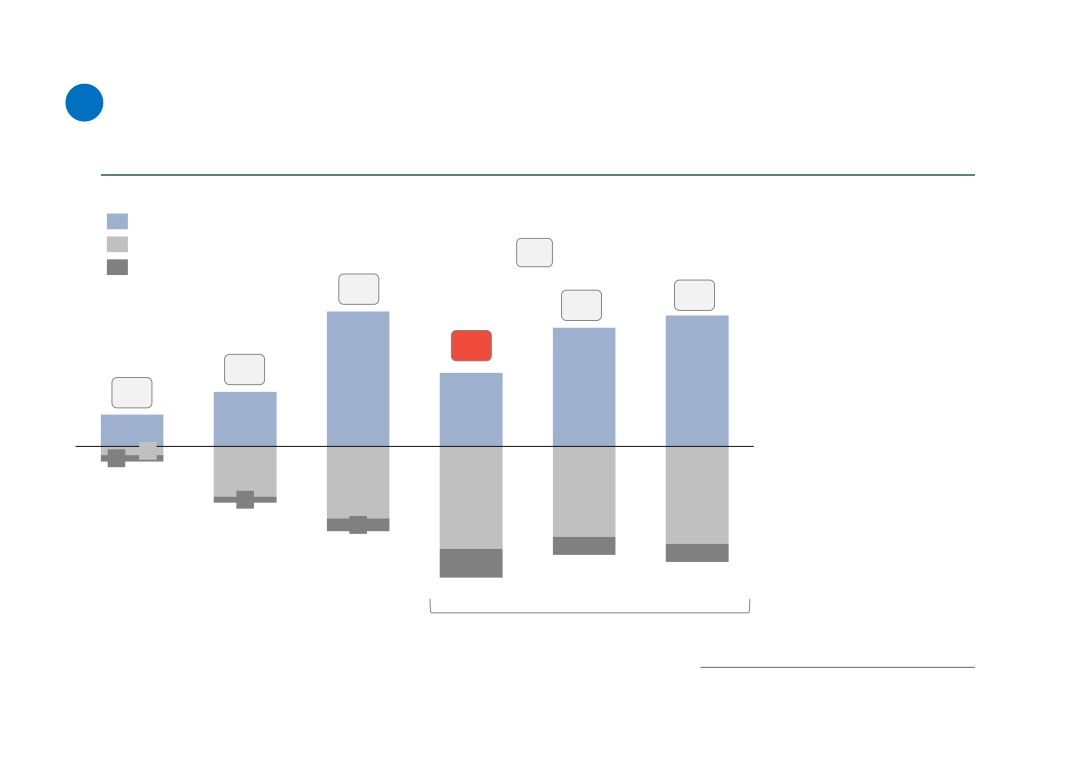
In the period from December 2013 to June 2019 Mr. Mazepin has achieved
3
effective ownership (control) over Uralkali of ~89%, squeezing out
ONEXIM of Mr. Prokhorov and minority shareholders
Dynamics of the change of equity structure of Uralkali from 2013 to 2019
Uralchem
Chengdong Investment Corp.
Rinsoco Trading (Mr. Lobyak)
Sberbank Investments
ONEXIM
Free-float
Uralkali-Technology
100%
100%
100%
RUB 126
bln. loan
from VTB
20%
20%
20%
Group
(8;9)
2014-2018
Rinsoco Trading.
Mr. Mazepin and Mr.
10%
Buy-out of ~55%
Mr. Lobyak
Lobyak formally
22%
20%
from minority
repurchased
control more than 40%,
shareholders for
back 10% from
but actually it is the full
more than RUB 247
Sberbank
control, as shares of
13%
bln. (12), including
Investments and
Uralkali-Technology are
credit funds from
became owner
quasi-treasury.
55%
the state banks of
with 20% of
Effective ownership
Russia (more than
shares (50)
(control) ~89% (14)
55%
USD 2 bln.) (11)
46%
10%
5%
5%
31 December
31 December
30 June
2013
2018
2019
(Х) - Reference to the source of information. The full list of sources of
information is presented at the end of the report
Mazepin Empire
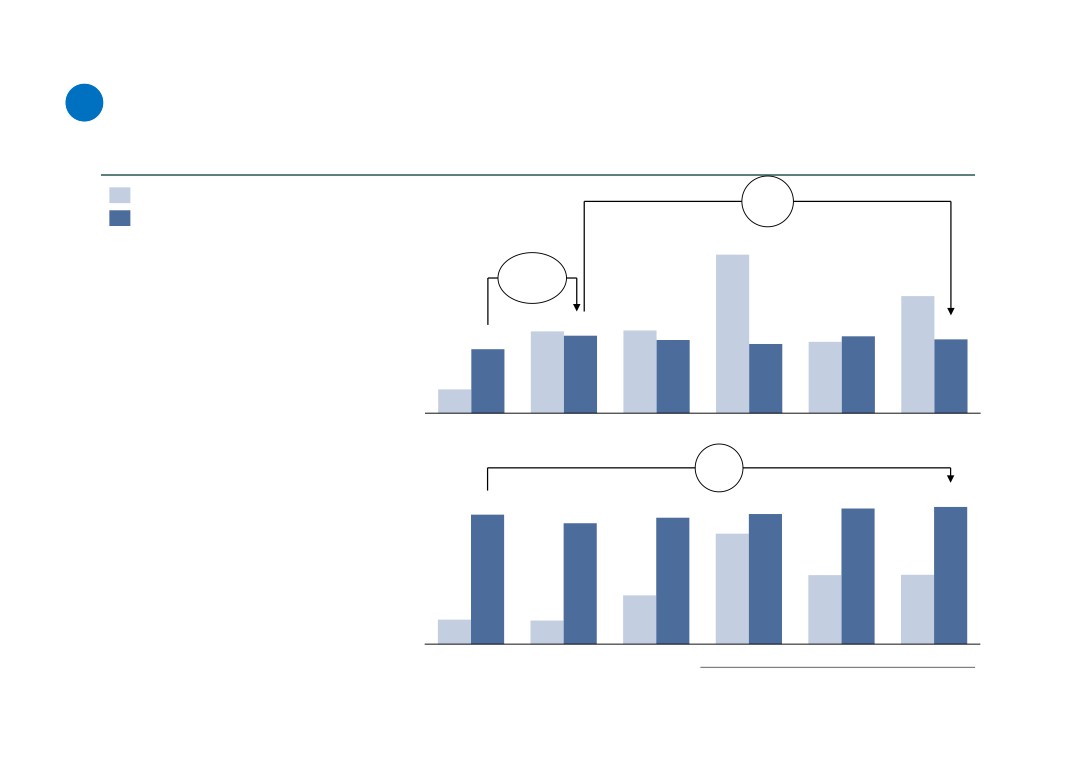
From the end of 2012 to the end of 2018, the debt of Uralchem and Uralkali
4
for loans and borrowings was increased by more than 4.5 times or RUB 537
billion from RUB 154 billion to RUB 691 billion, of which RUB 590 billion were
raised for the purchase and buy-out of Uralkali shares
Dynamics of the balance of borrowed funds of Uralchem and Uralkali, RUB billion
Uralchem - borrowed funds (16)
Uralchem - loans for purchase of ~20% share in Uralkali
Uralkali - borrowed funds (16)
Uralkali - loans for buy-out of shares from minority shareholders
+536
Amount of loans spent by Mr.
(+347%)
Mazepin to seize the control over
Uralkali (with accumulated foreign
793
currency revaluation)
Acquisition of 20%
share in Uralkali by
689
691
Mr. Mazepin
314
615
590
554
257
282
238
237
268
(51)
305
479
142
431
409
154
377
317
322
30
(52)
163
124
2012
2013
2014
2015
2016
2017
2018
2018
(Х) - Reference to the source of information. The full list of sources of
information is presented at the end of the report
Mazepin Empire
In 2013, Uralchem received a loan from VTB for the purchase of ~20% share in
5
Uralkali. Due to the excessive debt burden and weak operating results, Uralchem was
forced to start refinancing in 2014 and 2018 to stabilize cash flows and cover debt
service costs
Dynamics of proceeds and repayments of loans and borrowings by Uralchem for the period
2013-2018, RUB billion
Proceeds from loans and borrowings (53)
Repayment of loans and borrowings (54)
181
147
The loan received form
VTB Group in the amount
of USD 4.5 bln. for the
purposes of purchase of
~20% share in Uralkali
Most of the debt repayment in
2014 and 2018 was carried out
98
by refinancing the debt with
new loans and borrowings
37
22
21
18
16
8
7
4
0
0
0
2013
2014
2015
2016
2017
2018
Accumulated for
the period of
2013-2018
(Х) - Reference to the source of information. The full list of sources of
information is presented at the end of the report
Mazepin Empire
6
Uralkali is not able to serve its debt and has to raise new loans to
finance existing debt on a systematic basis
Dynamics of proceeds and repayments of loans and borrowings by Uralkali for the period of
2013-2018, RUB billion
Proceeds from loans and borrowings (55)
Repayment of loans and borrowings (56)
831
The company is not able to continue its operations without refinancing
188
historical debt on loans and borrowings, by raising new borrowings in
each of the periods under review
705
158
155
151
142
143
121
122
111
108
86
51
2013
2014
2015
2016
2017
2018
Accumulated for
the period of
2013-2018
(Х) - Reference to the source of information. The full list of sources of
information is presented at the end of the report
Mazepin Empire
Since Mr. Mazepin’s arrival, Uralchem and Uralkali made capital expenditures
7
only for maintaining the companies in operating condition. No investments in
development and production expansion were made
-0.6
Capital expenditure (CAPEX), RUB bln. Uralchem (17), Uralkali (21)
(-5%)
Production volume, mln. tons Uralchem (57), Uralkali (23)
Uralkali
24.7
+2.1
► decrease of production volume from
(+21%)
18.2
2014 to 2018 was 5% or 0.6 mln. tons
► increase of production volume from 2013
12.8
12.9
12.1
12.0
to 2014 was 21% or 2.1 mln. tons, which
11.4
11.1
11.5
10.8
10.0
is explained by the capital expenditures
made earlier (before Mr. Mazepin’s
arrival) (58)
3.7
► increase of capital expenditure from 2014
is explained by expenses incurred for
liquidation of accidents in the mines,
2013
2014
2015
2016
2017
2018
including sinkhole
+0,4
Uralchem
(6%)
6,3
6,4
►
increase of production volume from
6,0
6,1
5,9
5,6
2013 to 2018 was only 6% or 0.4 mln.
5,1
tons
► capital expenditures in the total
3,2
3,2
amount of RUB 14.9 bln. since 2014
were directed only for maintaining the
2,3
business in operating condition and
1,1
1,1
not for development and production
expansion
2013
2014
2015
2016
2017
2018
(Х) - Reference to the source of information. The full list of sources of
information is presented at the end of the report
Mazepin Empire
The average annual cash flow from the operating activity of Uralkali for the
8
period of 2016-2018 after payment of interest and mandatory capital
expenditures to maintain business in operating condition was RUB 34 billion
Dynamics of operating cash flows of Uralkali for the period of 2013-2018, RUB billion
Net cash flow from operating activity before interest payments (plus) (59)
Interest payments (minus) (59)
Net cash flow = net cash flow from operating activity before
Х
interest payments - minus interest payments - minus CAPEX
CAPEX (capital expenditure) (minus) (59)
77
Annual average cash flow for the period
►
Increase of interest
2016-2018 is RUB 34 billion
payments in the period
of 2015-2016 is explained
by raising credit funds
30
36
for buy-out of shares
36
37
from minority
37
37
shareholders
107
►
Total amount of the
24
shares buy-out for the
76
75
66
period of 2014-2018 was
60
equal to RUB 247 bln.
37
(12)
-9
-10
-4
-17
-21
-19
-21
-13
-13
-11
-18
-25
2013
2014
2015
2016
2017
2018
(Х) - Reference to the source of information. The full list of sources of
information is presented at the end of the report
Mazepin Empire
The average annual cash flow from the operating activity of Uralchem for the
9 period of 2016-2018 after payment of interests and mandatory capital
expenditures to maintain business in operating condition was negative -
minus 1.7 billion rubles
Dynamics of operating cash flows of Uralchem for the period of 2013-2018, RUB billion
Net cash flow from operating activity before interest payments (plus) (60)
Interest payments (minus) (60)
Net cash flow = net cash flow from operating activity before
Х
interest payments - minus interest payments - minus CAPEX
CAPEX (capital expenditure) (minus) (60)
9
3
►
Increase of interest
2
payment is explained by
raising credit funds at the
end of 2013 in USD from
-10
VTB Group for the
0
purchase of ~20% share
24
23
21
in Uralkali, as well as
3
increase of ruble
13
10
equivalent more than 2
6
times due to ruble
-2
devaluation
-1
-9
►
In absolute values -
-13
-16
increase of balance of the
-1
-18
-17
loan received in USD
amounted to RUB 142 bln.
-2
(from RUB 126 bln. (8;9)
-3
to RUB 268 bln. (52))
-3
-5
2013
2014
2015
2016
2017
2018
Annual average cash flow for the period
of 2016-2018 is negative - RUB 1.7
billion
(Х) - Reference to the source of information. The full list of sources of
information is presented at the end of the report
Mazepin Empire
Mr. Mazepin will not be able to repay the loans to the banks.
Uralchem - repayment of borrowed funds in the amount of RUB 282 billion is impossible, as the
10
company had a negative annual cash flow for the period of 3 years in 2016-2018,
Uralkali - repayment of borrowed funds in the amount of RUB 409 billion is possible within 12
years, but it is unlikely due to competitor’s entry (EuroChem Group) to the market in 2019
Net cash flow from the operating activity after repayment of interests and
Borrowed funds
mandatory CAPEX required to maintain business in operating condition, RUB
as at 31 December 2018 (16)
billion (61)
Uralchem
282
Repayment of the debt is
2
3
impossible.
RUB 282 bln. of the debt
against negative RUB 1.7
-1.7
bln. average cash flow for
-10
the period of 2016-2018
2016
2017
2018
2016-2018
31 December 2018
(average figure)
409
Uralkali
Repayment is possible
36
36
34
during 409 / 34 = 12
30
years. However it is
unlikely due to entry to
the market of EuroChem
Group
2016
2017
2018
2016-2018
31 December 2018
(average annual
figure)
(Х) - Reference to the source of information. The full list of sources of
Mazepin Empire
information is presented at the end of the report
Since the end of 2013, capitalization of Uralkali has decreased by
more than 2.5 times from RUB 506 billion to RUB 246 billion. The
11
company's shares are pledged to the banks and are not sufficient
to cover its total debt
Dynamics of capitalization and total debt of Uralkali
for the period of 2013-2018, RUB billion
Capitalization (62), RUB bln. (29)
Total debt, RUB bln. (83)
+134%
(+388)
X
Share price, rubles (29)
-51%
(-260)
760
665
677
599
534
523
506
485
382
344
289
246
172
130
178
165
117
84
2013
2014
2015
2016
2017
2018
(Х) - Reference to the source of information. The full list of sources of
information is presented at the end of the report
Mazepin Empire
In accordance with p.4 of art.99 of the Civil Code of the Russian Federation, if
12 a joint-stock company has negative net assets during 2 and more years, it is
subject to liquidation. The net assets of Uralchem have been negative for 5
years since 2014
Dynamics of the net assets’ change of Uralchem
for the period of 2014-2018, RUB billion
Assets (63)
►
Net assets value of Uralchem
significantly depends on the
Liabilities (63)
317
market value of the 20%
Net assets
investment in Uralkali, as
285
well as the corresponding
(assets less liabilities)
263
share in the net profit of
239
242
Uralkali
234
222
►
Capitalization of Uralkali, as
well as a net profit share, will
169
172
continue to decline due to
161
162
156
the real competition in the
Russian potash market that
started in 2019
►
Thus, the historical trend of
the net assets changes will
continue to show the same
pattern toward decline
5
-41
-77
-73
-83
-113
2013
2014
2015
2016
2017
2018
(Х) - Reference to the source of information. The full list of sources of
information is presented at the end of the report
Mazepin Empire
Uralkali, showing a positive trend of revenue and profit on sales, in fact has terminated
payment of dividends and significantly reduced income tax payments since 2014, i.e.
13
immediately after Mr. Mazepin’s arrival. For the period of 5 years in 2014-2018 only RUB
13.5 billion of income tax were paid. For comparison, before Mr. Mazepin’s arrival, for the
period of 3 years in 2011-2013 RUB 24.5 billion of income tax were paid
Dynamics of key performance indicators of Uralkali for the period of 2011-2018, RUB billion
Revenue (65)
Profit on sales (65;67)
Income tax (66)
Dividends paid (66)
Revenue and profit on sales
Income tax and dividend
157
2.5
2018
79
0.0
136
3.2
Result of work of
2017
63
0.0
Mr. Mazepin. After
his arrival at
131
2.6
Uralkali, the budget
2016
65
0.0
?
has received
nothing. Dividends
172
2.8
are not paid
2015
108
0.0
119
2.4
2014
59
10.7
96
5.5
2013
43
12.6
110
9.3
2012
63
25.4
100
9.7
2011
59
20.4
(Х) - Reference to the source of information. The full list of sources of
information is presented at the end of the report
Mazepin Empire
Uralkali, generating the largest profit on sales of Russian natural resources
in the Perm region (RUB 374 billion for the period of 5 years in 2014-2018),
14
paid only RUB 13.5 billion of income tax. For comparison, LUKOIL-Perm for
the same period paid 4 times more of income tax - by RUB 53.5 billion
The largest taxpayers of the Perm region
(accumulated in RUB billion for period of 5 years in 2014-2018)
Income tax paid (69) and
Profit on sales (67;68)
effective income tax rate (70)
13.5
374
Uralkali
4.0%
?
+40
53.5
351
LUKOIL - Perm
15.0%
LUKOIL -
23.1
131
Permneftegazsintez
18.0%
2.2
92
URALCHEM (64)
Profit on sales
2.4%
?
Income tax
6.0
37
Metafrax
16.0%
Effective income tax
(Income tax/Profit on sales)
1.4
8
Sveza Uralsky
17.0%
Gazprom
1.9
8
TransGaz
25.0%
Chaykovsky
(Х) - Reference to the source of information. The full list of sources of
information is presented at the end of the report
Mazepin Empire
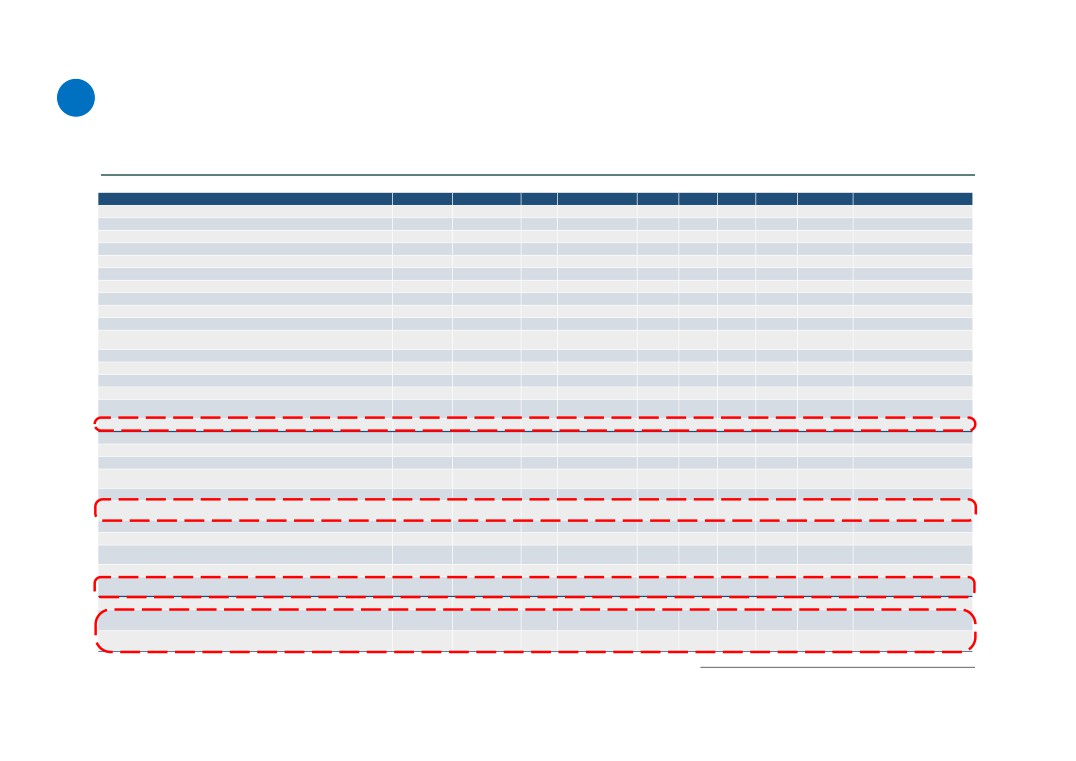
Assumptions used in calculating the underpaid taxes of Uralkali to
15
the budget of the Russian Federation for the period of 2014-2018
►
The source of the amounts spent on the buy-out of shares from minority shareholders included in the calculation is data from the
annual IFRS financial statements of the Uralkali Group from 2014 to 2018 (Cash flow statement)
►
The amount of the buy-out of shares from minority shareholders is equal to the amount of the received loan proceeds for the
following reasons:
-net cash flow from operating activities over the period of 5 years in 2014-2018 with interest paid was equal to RUB 297 billion (71)
-the amount of capital expenditures over the period of 5 years in 2014-2018 was equal to RUB 80 billion (21)
-the total amount of the buy-out of shares from minority shareholders over the period of 5 years in 2014-2018 was equal to RUB
247 billion (12)
-the balance of borrowed funds was increased by RUB 246 billion from RUB 163 to RUB 409 billion from the end of 2013 to the end
of 2018 (16)
Thus:
1. the increase in the balance of borrowed funds (RUB 246 billion) since the end of 2013 completely matches the total amount of
the buy-out of shares (RUB 247 billion)
2. net cash flow from operating activities completely covered the capital expenditures for maintaining operating and production
volumes of the Company (see slide 7,8,9)
3. the remaining positive cash flows could have been used to repay earlier received loans, but this did not happen. Free cash
flows were used for the buy-out of shares, whereas loans were not repaid and were regularly refinanced and revalued due to the
devaluation of the ruble against the dollar
4. a significant amount of the shares buy-out was financed by raising additional loans and borrowings
►
Borrowed funds of Uralkali are denominated in USD. According to the IFRS Financial statements, at the end of 2018, RUB 97
billion (72) were borrowed funds in rubles, RUB 312 billion (72) - borrowed funds in USD. According to the IFRS Financial
statements, at the end of 2013, RUB 90 billion (73) - borrowed funds in rubles, RUB 73 billion (73) - borrowed funds in USD. Thus,
the increase in borrowed funds by RUB 246 billion only relates to borrowed funds in USD.
►
The estimated effective interest rate for the entire loan portfolio is not significantly different from the interest rate on loans
received for financing of the buy-out of shares from minority shareholders. This fact is not in dispute, since the amount of such
loans is more than 75% of the total loan portfolio (RUB 322 billion and RUB 409 billion (51;16) as at 31 December 2018,
respectively)
►
The income tax rate is 15.5%. The rate was changed during the reference period from 15.5% to 16.5%. For the purposes of
simplifying the calculations only one rate was used - 15.5%. The possible effect is only more than calculated
(Х) - Reference to the source of information. The full list of sources of
information is presented at the end of the report
Mazepin Empire
Assumptions used in calculating the underpaid taxes of Uralkali to
16 the budget of the Russian Federation for the period of 2014-2018
(continued)
►
If there was a tax loss that has been taken into account for the calculation of the annual taxable profit since 2014, the estimated
effect on income tax has been carried forward to the future tax periods. The overall effect of the underpaid income tax remains the
same
►
Dividend tax rate - 15% (for non-residents of the Russian Federation)
►
We understand that dividends should be paid from net profit and remain a decision that is to be taken by a general meeting of
shareholders
►
However, there is no doubt that the repayment of dividends have been actually terminated since 2014 due to Mr. Mazepin’s arrival at
Uralkali at the end of 2013 due to the following reasons:
► For the period of 4 years in 2011-2014, Uralkali paid RUB 69 billion of dividends, while for the period of 4 years in 2015-2018
only RUB 27 million
► Net profit for 4 years in 2011-2014 was equal to RUB 126 billion, while for the period of 4 years in 2015-2018, it was equal to
RUB 132 billion
► Thus, the net profit was increased by RUB 6 billion, whereas amount of dividends paid was only RUB 27 million instead of
RUB 69 billion. So, the dividend payments have been terminated
► The termination of dividend payments is explained by the lack of available cash, as all available funds were used for the
repayment and service of the debt (incl. fees, interest and foreign currency revaluation) for the loans obtained for the
purpose of the buy-out of shares from minority shareholders (the total amount of the buy-out was RUB 247 billion)
►
Therefore, two calculations were performed to calculate underpaid tax on dividends:
► The minimum amount of possible unpaid dividends is calculated based on historical data of dividend payments in
proportion to the profit on sales for the period of 3 years in 2011-2013 before the start of the buy-out of shares from minority
shareholders
► The maximum amount of possible unpaid dividends is calculated based on the statistics of dividend payments in proportion
to the profit on sales of LUKOIL-Perm, similar to Uralkali in terms of revenue and profit on sales for the same period of 5
years in 2014-2018. LUKOIL-Perm and Uralkali are two of the largest enterprises in the Perm region. The production activities
of both companies are based on the extraction of minerals in the Perm region of the Russian Federation
► The Line «Dividends paid» in the RAS Financial statements, Form №4, Cash flow statement of companies Uralchem,
LUKOIL-Perm also includes the tax paid on dividends
(Х) - Reference to the source of information. The full list of sources of
information is presented at the end of the report
Mazepin Empire
RUB 37.9 billion and RUB 54.1 billion - the minimum and maximum amounts
of the underpaid taxes of Uralkali to the budget of the Russian Federation for
17
the period of 2014-2018 due to raising credit financing for the buy-out of
shares from minority shareholders. It is 25% more than the budget of the city
of Perm for 2019 (RUB 28.4 billion)
i
0
1
2
3
4
5
6
7
Line
Unit of measure
2011-2013
2013
2014
2015
2016
2017
2018
2014-2018
Reference/Formula
INCOME TAX
Exchange rate (at the end of the period) (81)
RUB/USD
32,7
56,3
72,9
60,7
57,6
69,5
Xi
Exchange rate (at the end of the period), %
%
1,7
1,3
0,8
0,9
1,2
Qi=Xi/X(i-1)
Average exchange rate (84)
31,9
38,4
61,0
67,0
58,4
62,7
Ci
Loans and borrowings (16)
RUB bln.
163,1
316,6
478,8
431,1
377,0
408,9
Yi
Interest expense (76)
RUB bln.
9,0
10,1
16,9
21,3
18,8
20,3
Zi
Interest expense, effective rate
%
4,2%
4,3%
4,7%
4,7%
5,2%
Vi=Zi/(Yi-Y(i-1)/2)
Loans for buy-out of shares (12)
RUB bln.
64,6
140,3
33,6
1,5
7,1
Fi
Loans for buy-out of shares, accumulated
RUB bln.
64,6
204,9
238,5
240,0
247,1
Wi=Wi-1+Fi
Loans for buy-out of shares (currency equivalent)
USD bln.
1,68
2,30
0,50
0,03
0,11
Hi=Fi/Ci
Loans for buy-out of shares (currency equivalent), accumulated
USD bln.
1,7
4,0
4,5
4,5
4,6
Ji=J(i-1)+Hi
Foreign currency revaluation for loans
RUB bln.
39,6
47,1
-
51,8
-
13,7
54,2
75,3
Si=(Wi-W(i-1)/2)*Qi
Foreign currency revaluation for loans, accumulated
RUB bln.
39,6
86,6
34,9
21,1
75,3
Ri=R(i-1)+Si
Loans with accumulated foreign currency revaluation
RUB bln.
104,2
291,5
273,4
261,2
322,4
Li=Wi+Ri
Interest expense for the loans
RUB bln.
2,2
8,4
13,2
12,4
15,1
51,4
XXi=(Li-L(i-1)/2)*Vi
Additional expenses recognized for the decrease of the taxable profit
RUB bln.
41,8
55,5
-
38,5
-
1,3
69,3
126,7
Ui=XXi+Si
Underpaid income tax
RUB bln.
6,5
8,6
-
6,0
-
0,2
10,7
19,6
TAX1i=Ui*15,5%
DIVIDEND TAX
Profit on sales (68)
RUB bln.
165,1
58,9
108,4
65,2
62,7
78,9
374,2
Ti
Actually dividends paid (82)
RUB bln.
58,4
10,7
0,02
0,01
-
-
10,7
Mi
(Dividends/Profit on sales) for 2011-2013 * 100%
%
35,4%
N0=M0/T0
Possible unpaid dividends - MIN
RUB bln.
10,2
38,3
23,1
22,2
27,9
121,7
Bi=Ti*N0-Mi
Underpaid tax for possible unpaid dividends - MIN
RUB bln.
1,5
5,7
3,5
3,3
4,2
TAX2i=Bi*15%
18,3
Profit on sales - LUKOIL-Perm (68)
RUB bln.
45,4
66,5
69,8
69,8
99,1
350,6
Oi
Dividends - LUKOIL-Perm (82)
RUB bln.
28,3
24,0
77,3
36,7
49,0
215,3
Ai
(Dividends/Profit on sales) for 2014-2018 - LUKOIL-Perm
%
62,2%
36,1%
110,8%
52,6%
49,5%
61,4%
Ei=Ai/Oi
Possible unpaid dividends - MAX
RUB bln.
36,2
66,6
40,1
38,5
48,5
229,8
Gi=Ti*E7
Underpaid tax for possible unpaid dividends - MAX
RUB bln.
5,4
10,0
6,0
5,8
7,3
TAX3i=Gi*15%
34,5
TOTAL:
Underpaid tax to the budget of Russian Federation - MIN
RUB bln.
8,0
14,4
-
2,5
3,1
14,9
TAX1i+TAX2i
37,9
Underpaid tax to the budget of Russian Federation - MAX
RUB bln.
11,9
18,6
0,0
5,6
18,0
TAX1i+TAX3i
54,1
(Х) - Reference to the source of information. The full list of sources of
information is presented at the end of the report
Mazepin Empire
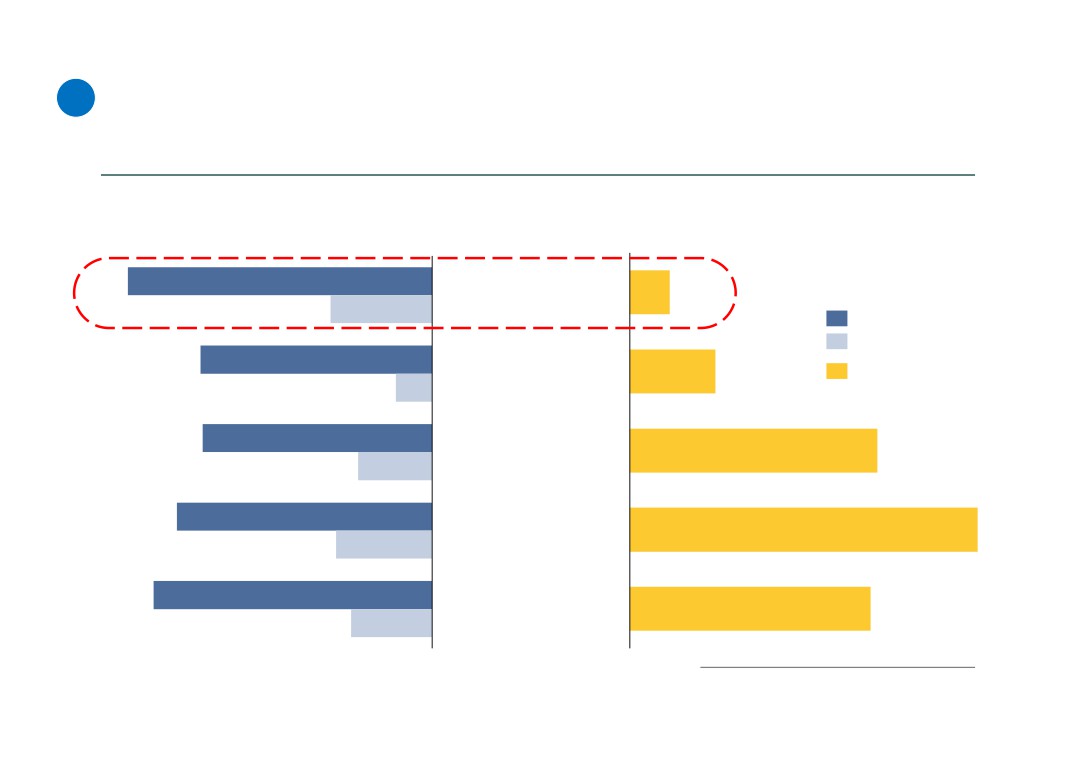
Uralchem has the highest revenue and profit on sales compared to its competitors, but does not
18
pay taxes on profit and dividends to the budget- only RUB 2.7 billion have been paid since the
end of 2013. For example, two comparable companies belonging to the Swiss Group EuroChem,
Nevinnomyssk Azot and NAK Azot, having a lower profit margin on sales, has paid RUB 39.9
billion since the end of 2013 - 15 times more than Uralchem
Key performance indicators of analogues companies in comparison with Uralchem
(accumulated in RUB billion for period of 5 years in 2014-2018)
Financial Indicators (74)
Tax payments to the budget of RF (75)
275
URALCHEM
2.7
92
?
Revenue
Profit on sales
210
Tax on profit and
KuibyshevAzot
5.7
33
dividends (in total)
207
EhroChem -
16.6
Nevinnomyssk Azot
67
231
EuroChem -
23.3
NAK Azot
87
252
Togliattiazot
16.1
73
(Х) - Reference to the source of information. The full list of sources of
information is presented at the end of the report
Mazepin Empire
Assumptions used in calculating the underpaid taxes of Uralchem
19 to the budget of the Russian Federation for the period of 2014-
2018
►
The loan amount in USD received from VTB Group in December 2013 for the purposes of financing the acquisition of 20% shares
in Uralkali was equal to RUB 126.3 billion in the ruble equivalent (8)
►
The estimated effective interest rate for the entire loan portfolio is not significantly different from the interest rate on loans
received for financing of the acquisition of the shares. This fact is not in dispute, since the amount of such loans is more than
90% of the total loan portfolio of the company (RUB 268 billion and RUB 282 billion (52;16) as at 31 December 2018, respectively)
►
Income tax rate - 20%
►
If there was a tax loss that has been taken into account for the calculation of the annual taxable profit since 2014, the estimated
effect on income tax has been carried forward to the future tax periods. The overall effect of the underpaid income tax remains the
same
►
Dividend tax rate - 15% (for non-residents of the Russian Federation)
►
We understand that dividends should be paid from net profit and remain a decision that is to be taken by a general meeting of
shareholders
►
Nevertheless, there is no doubt that the dividend payments have been actually terminated since 2015 in connection with the
purchase of the 20% share in Uralkali by using the loan proceeds received from VTB Group:
► Profit on sales for the period of 2015-2018 amounted to RUB 82 billion, for the period of 2011-2013 - RUB 32 billion
► The amount of dividends paid for the period of 2011-2014 was RUB 11.2 billion. For the period of 2015-2018, no dividends
were paid
► Thus, the profit on sales increased 2.5 times from RUB 32 billion to RUB 82 billion, but dividend payments were terminated
► Net profit was reduced due to interest, exchange rate revaluation, as well as accrual of reserves for the investment in
Uralkali (as the share price decreased more than 2 times since the acquisition). For the period of 2014-2018, Uralchem
showed a net loss of RUB 96 billion, while profit on sales was positive RUB 92 billion
► The termination of dividend payments is explained by the lack of available cash, as all available funds were used for the
repayment and service of the debt (incl. fees, interest and foreign currency revaluation) for the loans obtained for the
purpose of the buy-out of shares from minority shareholders (RUB 126 billion in ruble equivalent)
(Х) - Reference to the source of information. The full list of sources of
information is presented at the end of the report
Mazepin Empire
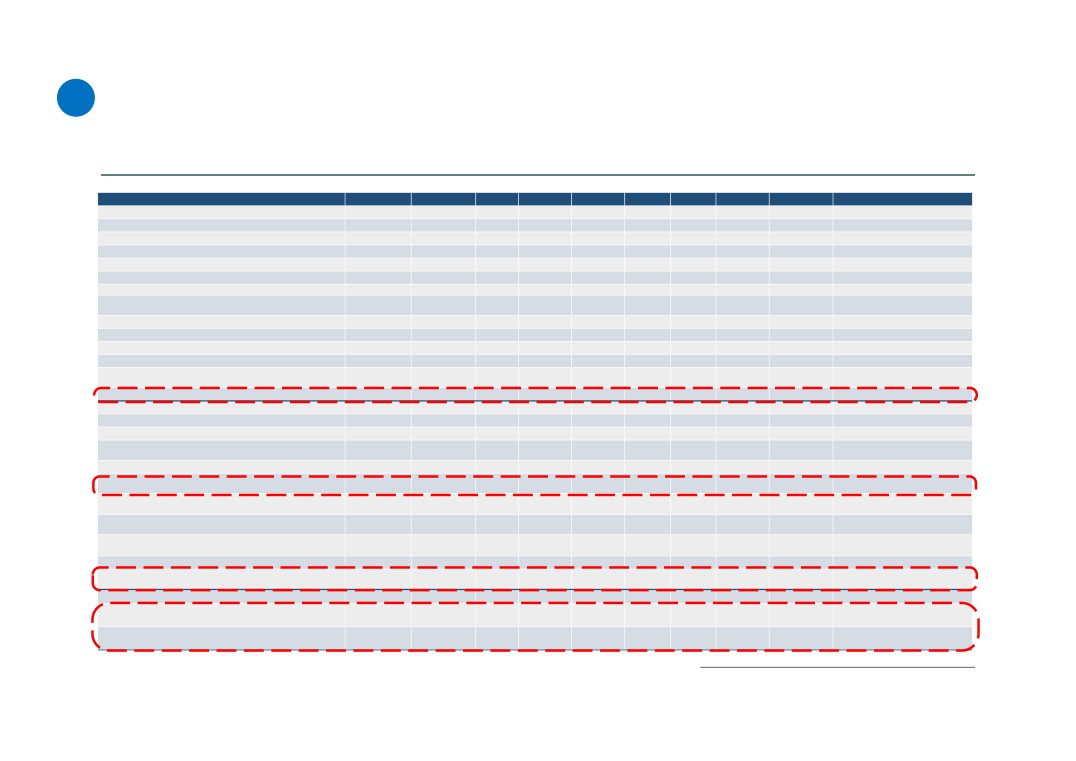
Assumptions used in calculating the underpaid taxes of Uralchem
20 to the budget of the Russian Federation for the period of 2014-
2018 (continued)
► Therefore, two calculations were performed to calculate underpaid tax on dividends:
► The minimum amount of possible unpaid dividends is calculated based on historical data of dividend payments in
proportion to sales over a period of 3 years in 2011-2013 prior to raising the loan proceeds for financing of the acquisition
of the 20% shares in Uralkali
► The maximum amount of possible unpaid dividends is calculated based on the statistics of dividend payments in
proportion to the profit on sales of comparable to Uralchem companies in terms of revenue and profit on sales for the
same period of 5 years in 2014-2018. These are companies of EuroChem Group - Nevinnomyssk Azot and NAK Azot
► The Line «Dividends paid» in the RAS Financial statements, Form #4, Cash flow statements of companies Uralchem, EuroChem -
Nevinnomyssk Azot and NAK Azot also includes the tax paid on dividends
(Х) - Reference to the source of information. The full list of sources of
information is presented at the end of the report
Mazepin Empire
RUB 45.8 billion and RUB 51.8 billion - the minimum and maximum amounts
of the underpaid taxes of Uralchem to the budget of the Russian Federation
21
for the period of 2014-2018 due to raising credit financing for the purchase of
~20% shares in Uralkali. It is 1.5 times more than the budget of the city of
Perm for 2019 (RUB 28.4 billion)
i
0
1
2
3
4
5
6
7
Line
Unit of measure
2011-2013
2013
2014
2015
2016
2017
2018
2014-2018
Reference/Formula
INCOME TAX
Exchange rate (at the end of the period) (81)
RUB/USD
32,7
56,3
72,9
60,7
57,6
69,5
Xi
Exchange rate (at the end of the period) ), %
%
171,9%
222,7%
185,3%
176,0%
212,3%
Qi=Xi/X(i-1)
Loans and borrowings (16)
RUB bln.
141,6
237,0
314,1
257,4
237,9
281,6
Yi
Interest expense (76)
RUB bln.
1,5
7,9
12,7
18,4
15,8
17,0
Zi
Interest expense, effective rate
%
4,1%
4,6%
6,4%
6,4%
6,5%
V=Zi/(Yi-Y(i-1)/2)
Amount of the loan for acquisition of 19,99% (8,10)
RUB bln.
126,3
126,3
126,3
126,3
126,3
126,3
Wi
Amount of the loan for acquisition of 19,99% (currency equivalent)
USD bln.
3,9
3,9
3,9
3,9
3,9
3,9
Ji=Wi/X1
Foreign currency revaluation for the loan
RUB bln.
-
90,8
64,1
-
47,2
-
11,8
45,8
141,7
Si=(Wi-W(i-1)/2)*Qi
Foreign currency revaluation, accumulated
RUB bln.
90,8
154,9
107,7
95,9
141,7
Ri=R(i-1)+Si
Loan with accumulated foreign currency revaluation
RUB bln.
126,3
217,0
281,2
234,0
222,2
268,0
Li=Wi+Ri
Interest expense for the loan
RUB bln.
7,1
11,5
16,6
14,6
16,0
65,8
XXi=(Li-L(i-1)/2)*Vi
Additional expenses recognized for the decrease of the taxable profit
RUB bln.
97,9
75,6
-
30,6
2,8
61,8
207,5
Ui=XXi+Si
Underpaid income tax
RUB bln.
19,6
15,1
-
6,1
0,6
12,4
TAX1i=Ui*20%
41,5
DIVIDEND TAX
Profit on sales (74)
RUB bln.
22,6
9,4
20,6
16,9
16,7
28,2
91,8
Ti
Actually dividends paid (75)
RUB bln.
7,9
3,3
-
-
-
-
3,3
Mi
(Dividends paid/Profit on sale) for 2011-2013 * 100%
%
34,9%
N0=M0/T0
Possible unpaid dividends - MIN
RUB bln.
-
0,0
7,2
5,9
5,8
9,9
28,7
Bi=Ti*N0-Mi
Underpaid tax for possible unpaid dividends - MIN
RUB bln.
-
0,0
1,1
0,9
0,9
1,5
TAX2i=Bi*15%
4,3
Profit on sales - EuroChem - Nevinnomyssk Azot and NAK Azot
RUB bln.
24,1
44,4
27,7
23,8
33,9
153,9
Oi
(total) (74)
Dividends - Nevinnomyssk Azot and NAK Azot (total) (75)
RUB bln.
34,2
30,6
19,3
17,8
13,0
114,9
Ai
(Dividends/Profit on sales) for 2014-2018 - Nevinnomyssk Azot and
%
141,9%
68,9%
69,9%
74,7%
38,3%
74,7%
Ei=Ai/Oi
NAK Azot (total)
Possible unpaid dividends - MAX
RUB bln.
7,0
15,4
12,6
12,5
21,1
68,6
Gi=Ti*E7
Underpaid tax for possible unpaid dividends - MAX
RUB bln.
1,1
2,3
1,9
1,9
3,2
TAX3i=Gi*15%
10,3
TOTAL:
Underpaid tax to the budget of Russian Federation MIN
RUB bln.
19,6
16,2
-
5,2
1,4
13,8
TAX1i+TAX2i
45,8
Underpaid tax to the budget of Russian Federation MAX
RUB bln.
20,6
17,4
-
4,2
2,4
15,5
TAX1i+TAX3i
51,8
(Х) - Reference to the source of information. The full list of sources of
information is presented at the end of the report
Mazepin Empire
Sources of information (1/7)
0.
1,1 USD bln. = (3)+(7)+(4)+(5) the estimated amount that Mr. Mazepin paid for the 4 production assets
1. RAS Financial statements for 2018 of Uralchem and Uralkali. Form №2, Line «Revenue»
podrobnosti-sozdaniya-Uralkhima/
8. RAS Financial statements for 2013. Uralchem. Note 11. Loans and borrowings
9. RAS Financial statements for 2013. Uralchem. Note 5. Investments
10. IFRS Financial statements for 2013. Uralchem. Note 27. Loans and borrowings
11. RAS Financial statements for 2016. Uralkali. Note 4. Loans and borrowings. Repayment terms of loans, borrowings and
bonds as at 31 December 2016
12. IFRS Financial statements for 2014-2018. Uralkali. Cash flow statement, Line «Buy-out of shares», accumulated for
2014-2018
14.89%=40%+ 40%*(55%/(40%+5%))
16. RAS Financial statements for 2013 - 2018 of Uralchem and Uralkali. Form №1, Line «Loans and borrowings»
Mazepin Empire
Sources of information (2/7)
17. RAS Financial statements for 2013 - 2018. Uralchem. Form №4, Line «Acquisition of long-term assets»
18. Value «RAS Financial statements for 2013. Uralchem. Form №1, Line «Loans and borrowings» accumulated» less value
«RAS Financial statements for 2018 Uralchem. Form №1, Line «Loans and borrowings» accumulated»
19. Annual report for 2013. Uralchem. Page 36.
20. Official website of Uralchem
21. RAS Financial statements for 2013 - 2018. Uralkali. Form №4, Line «Acquisition of long-term assets»
22. Value «RAS Financial statements for 2013. Uralkali. Form №1, Line «Loans and borrowings» accumulated» less «RAS
Financial statements for 2018 Uralkali. Form №1, Line «Loans and borrowings» accumulated»
23. Annual report for 2018. Uralkali. Page 10. Production volume
24. RUB 157 bln.= Value «RAS Financial statements for 2016-2018. Uralkali. Form №4, Line «Net cash flow from operating
activity» accumulated»
RUB 54 bln. = Value «RAS Financial statements for 2016-2018. Uralkali. Form №4, Line «Acquisition of long-term
assets»
34=(157-54)/3
25. Official website of EUROCHEM
27. Official website of EUROCHEM
Mazepin Empire
Sources of information (3/7)
28. IFRS Financial statements for 2018. Uralkali. Note 14. Equity. Page. 41
30. RAS Financial statements for 2014. Uralchem. Form №1, Section «III. Capital and reserves», Line «Total for the section
III»
31. RAS Financial statements for 2018. Uralchem. Form №1, Section «III. Capital and reserves», Line «Total for the section
III»
32. RUB 6.5 bln. = Value «RAS Financial statements for 2016-2018. Uralkali. Form №4, Line «Net cash flow from operating
activity» accumulated»
RUB 11.6 bln. = Value «RAS Financial statements for 2016-2018. Uralkali. Form №4, Line «Acquisition of long-term
assets»
-1.7=(6.5-11.6)/3
33. RAS Financial statements for 2014-2018. Uralchem. Form №2, Line «Net profit «loss»
34. Slide 21 - accumulated effect of unpaid taxes/5
35. Slide 17; Slide 21. Line «Foreign currency revaluation for loans»
36. RAS Financial statements for 2014-2018. Uralkali. Form №4, Line «Income tax»
37. RAS Financial statements for 2011-2013. Uralkali. Form №4, Line «Income tax»
38. RAS Financial statements for 2014-2018. LLC «LUKOIL-Perm». Form №4, Line «Income tax»
39. RAS Financial statements for 2014-2018. Uralchem. Form №4, Line «Income tax»
Mazepin Empire
Sources of information (4/7)
40. RUB 10.2 bln. = Value «RAS Financial statements for 2014-2018. Nevinnomyssk Azot. Form №4, Line «Income tax»
RUB 49.1 bln. = Value «RAS Financial statements for 2014-2018. Nevinnomyssk Azot. Form №4, Line «Dividends paid»
RUB 14.7 bln. = Value RAS Financial statements for 2014-2018. NAK Azot. Form №4, Line «Income tax»
RUB 65.9 bln. = Value RAS Financial statements for 2014-2018. NAK Azot. Form №4, Line «Dividends paid»
RUB 39,8 bln. = 10.2+49.1*13%+14.7+65.9*13%
13% - dividend tax for tax residents in Russia
41. Calculation of the tax effect for Uralkali. Slide 17
42. Calculation of the tax effect for Uralchem. Slide 21
43. Business model of Uralkali
44. Official website of Uralkali
45. RAS Financial statements за 2016. Uralkali. Note 4. Loans and borrowings. Repayment terms of loans, borrowings and
bonds as at 31 December 2015
46. Data from international consulting agencies - open sources
47. Data from international consulting agencies - open sources
48. Request for buy-out of securities of a joint-stock company
49. VTB Group - RUB 4.5 bln. - RAS Financial statements for 2013. Uralchem. Note 11. Loans and borrowings.
Sberbank - RUB 2 bln. - RAS Financial statements for 2016. Uralkali. Note 4. Loans and borrowings. Repayment terms
of loans, borrowings and bonds as at 31 December 2016
Mazepin Empire
Sources of information (5/7)
51. RUB 322 bln. - balance of loans with accumulated effected of foreign currency revaluation as at 31 December 2018,
received by Uralkali for the buy-out of shares of Uralkali from minority shareholders during 2014-2018. The calculation is
presented on the slide 17, Line «Amount of loans with accumulated foreign currency revaluation»
52. RUB 268 bln. - balance of loans with accumulated effected of foreign currency revaluation as at 31 December 2018,
received by Uralchem for acquisition of the 20% shares in Uralkali in 2013. The calculation is presented on the slide 21,
Line «Amount of loans with accumulated foreign currency revaluation»
53. RAS Financial statements for 2013-2018. Uralchem. Form №4, Line «Proceeds from loans and borrowings»
54. RAS Financial statements for 2013-2018. Uralchem. Form №4, Line «Repayment of loans and borrowings»
55. RAS Financial statements for 2013-2018. Uralkali. Form №4, Line «Proceeds from loans and borrowings»
56. RAS Financial statements for 2013-2018. Uralkali. Form №4, Line «Repayment of loans and borrowings»
58. Completion of expansion of mine management Berezniki-4 in 2012- production capacity was increased from 11.5 to 13
mln. tons
59. RAS Financial statements for 2013-2018. Uralkali. Form №4, Lines
-«Net cash flow from operating activity»
-«Repayment of interests for debt holding»
-«Sale of long-term assets»
60. RAS Financial statements for 2013-2018. Uralchem. Form №4, Lines
-«Net cash flow from operating activity»
-«Repayment of interests for debt holding»
-«Sale of long-term assets»
Mazepin Empire
Sources of information (6/7)
61. Slide 8-9 of explanatory information
62. Capitalization = market price of one share * quantity of shares (2 936 015 891 shares), source - MOEX, Moscow
exchange
63. RAS Financial statements for 2013-2018. Uralchem. Form №1, Line
«Long-term assets» + «Short-term assets»
«Long-term liabilities» + «Short-term liabilities»
64. Data for Uralchem is presented for all branches accumulated, including the branch, registered in Perm region
65. RAS Financial statements for 2013-2018. Uralkali. Form №2, Lines
«Revenue»
«Profit (loss) on sales»
66. RAS Financial statements for 2011-2018. Uralkali. Form №4, Lines
«Income tax»
«Dividends paid»
67. «Profit on sales» - Revenue less all expenses for operating activity (cost of sales, administrative and commercial
expenses)
68. RAS Financial statements for 2011-2018. Form №2, Line «Profit (loss) on sales for companies» Uralkali, LUKOIL-Perm,
LUKOIL-Permneftegazsintez, Uralchem, Metafrax, Sveza Uralsky, Gazprom TransGaz Chaykovsky
69. RAS Financial statements for 2011-2018. Form №4, Line «Income tax» for companies Uralkali, LUKOIL-Perm, LUKOIL-
Permneftegazsintez, Uralchem, Metafrax, Sveza Uralsky, Gazprom TransGaz Chaykovsky
70. Effective rate = Income tax (69) / Profit on sales (68)
71. RAS Financial statements for 2013-2018. Uralkali. Form №4, Lines
-«Net cash flow from operating activity»
Mazepin Empire
Sources of information (7/7)
72. IFRS Financial statements of Uralkali for 2018. Note 15. Loans and borrowings
73. IFRS Financial statements of Uralkali for 2013. Note 22. Loans and borrowings
74. RAS Financial statements for 2011-2018. Uralchem. Form №2, Lines «Revenue», «Profit (loss) on sales» for companies
Uralchem, KuibyshevAzot, EuroChem - Nevinnomyssk Azot, EuroChem - NAK Azot, Togliattiazot
75. RAS Financial statements за 2011-2018. Uralchem. Form №4, Line «Income tax» for companies Uralchem,
KuibyshevAzot, EuroChem - Nevinnomyssk azot, EuroChem - NAK Azot, Togliattiazot
RAS Financial statements for 2014-2018. Uralchem. Form №4, Line (accumulated) «Dividends paid» for companies
Uralchem (15%), KuibyshevAzot (13%), EuroChem - Nevinnomyssk Azot (13%), EuroChem - NAK Azot (13%), Togliattiazot
(15%)
76. RAS Financial statements for 2014-2018. Uralkali, Uralchem. Form №2, Line «Interest expense»
77. RAS Financial statements за 2014-2018. Uralkali.
78. IFRS Financial statements за 2014-2018. Uralkali. Note Equity.
79. (Quantity of shares Uralkali 2936 (78) * Market price for one share (Декабрь 2013) 170,6 (29))*20% = RUB 100 bln.
80. Slide 17; Slide 21. Line «Interest expense for loans»
82. RAS Financial statements for 2011-2018. Form №4, Line «Dividends paid» for companies Uralkali, LUKOIL-Perm
83. Total debt = Loans and borrowings of Uralkali (1) + Loan Uralchem, received for acquisition of the 20% shares in
Uralkali (2)
(1) = RAS Financial statements for 2013 - 2018. Uralchem, Uralkali. Form №1, Line «Loan and borrowings»
(2) = Slide 21 Line Loan with accumulated foreign currency revaluation
Mazepin Empire